Bitcoin 2026 Outlook
As Bitcoin traders turn their attention toward 2026, the cryptocurrency finds itself at a critical juncture. The current price action, chart patterns, and fundamental indicators are painting a complex picture that requires careful analysis. For active traders planning their 2026 positions, understanding what the charts are telling us right now is essential for navigating the months ahead.
The uncertainty surrounding Bitcoin’s direction isn’t a weakness—it’s information. Markets consolidate before major moves, and the technical and fundamental data available today provide valuable clues about Bitcoin’s trajectory into 2026.
Key Chart Patterns Forming in Bitcoin Right Now
Weekly Timeframe Consolidation Patterns
Bitcoin’s weekly chart is currently displaying a classic consolidation structure that seasoned traders recognize as a precursor to significant price movements. The range established over recent months has created clearly defined boundaries that will likely determine the asset’s direction through 2026.
The upper boundary sits in a zone where previous sellers have emerged, creating a resistance cluster that has rejected multiple attempts at a breakthrough. Meanwhile, the lower support has been tested repeatedly, with buyers stepping in to defend these levels. This compression pattern typically resolves with a directional move that matches the timeframe of the consolidation—suggesting any breakout could fuel momentum well into 2026.
Triangle patterns have also emerged on the weekly timeframe, characterized by lower highs meeting higher lows. This convergence indicates decreasing volatility and indecision, but history shows these formations often precede volatility expansion. The apex of current triangle formations points to resolution periods that align with Q1 or Q2 of 2026.
Critical Support and Resistance Zones
Identifying the levels that matter most requires looking beyond simple horizontal lines. Current chart analysis reveals several critical zones where significant trading activity has occurred:
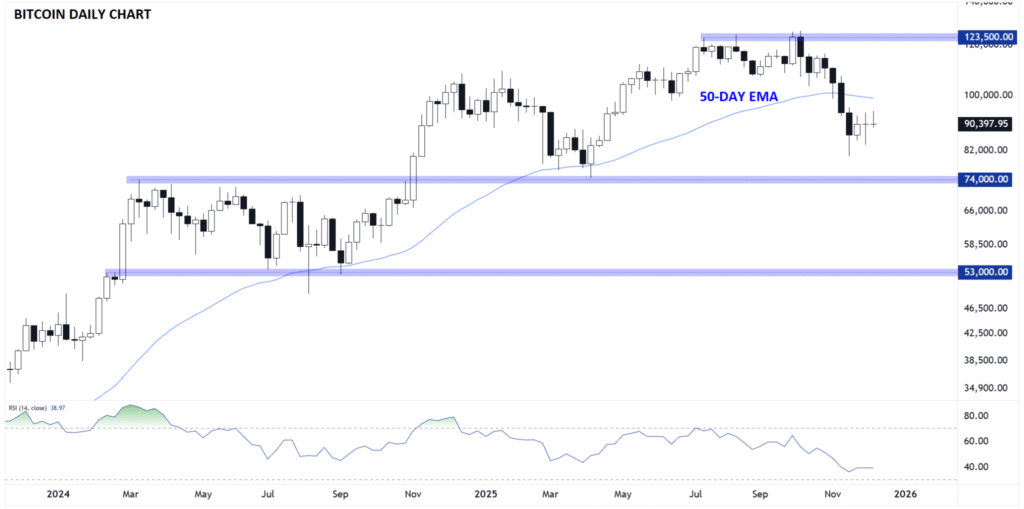
The primary resistance zone encompasses the area where Bitcoin has struggled to maintain upward momentum. This region coincides with the 200-week moving average on some timeframes, a historically significant indicator that has marked major trend transitions. Multiple rejections at this level have created what technical analysts call a “supply zone”—an area where sellers have proven willing to distribute their holdings.
Below current prices, the primary support zone represents an area of previous resistance that flipped to support during earlier rallies. This zone has absorbed selling pressure multiple times, indicating strong buyer conviction. A breach of this level would open the door to deeper support levels that haven’t been tested in over a year.
Secondary levels exist between these primary zones, creating a ladder of potential pivot points. These intermediate levels often act as temporary resting points during directional moves, providing areas where short-term traders take profits and new positions accumulate.
Volume Profile Analysis
Volume profile analysis reveals where the most trading activity has occurred at different price levels, providing insight into value areas and potential price magnetism. Current volume profiles show a concentration of trading activity within the consolidation range, creating a high-volume node that could act as a gravitational pull during volatile periods.
Below current prices, low-volume nodes indicate areas where Bitcoin might move quickly if support breaks, as there’s little prior trading activity to provide support or resistance. These zones represent inefficiencies in the market structure that typically fill rapidly during directional moves.
The volume profile also reveals point-of-control levels—the prices where the most volume has traded. These levels often act as fair value areas where the market seeks to return during periods of uncertainty. As we head into 2026, these point-of-control levels will likely serve as reference points for determining whether Bitcoin is trading at a premium or discount.
Moving Average Convergence Signals
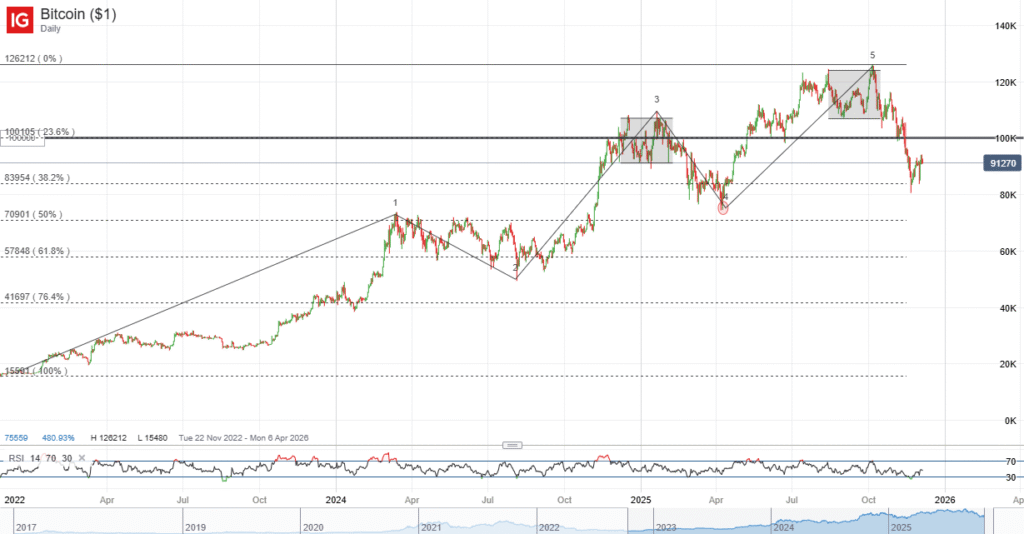
Moving averages are compressing on multiple timeframes, creating setups that historically precede significant trends. The 50-week and 200-week moving averages are approaching each other, with the relationship between these indicators often marking major trend transitions.
On the daily timeframe, shorter-period moving averages have oscillated around longer-period averages, creating numerous crossover signals that have lacked follow-through. This behavior is characteristic of ranging markets, but the convergence pattern suggests this indecision won’t persist indefinitely.
The Exponential Moving Averages (EMAs) tell a similar story, with the 20-week, 50-week, and 100-week EMAs clustering together. This compression reduces the distance price must travel to transform the technical structure from neutral to bullish or bearish. When these moving averages finally diverge, they typically remain separated for extended periods, potentially establishing the technical backdrop for Bitcoin’s 2026 trajectory.
Fundamental Data Pointing to Bitcoin’s 2026 Path
Halving Cycle Implications
Bitcoin’s programmatic supply schedule places 2026 in a specific phase of the four-year halving cycle. The most recent halving occurred in 2024, making 2026 approximately two years post-halving—a period that has historically marked the latter stages of bull markets or the transition into consolidation phases.
Previous cycles show that the second year after a halving often experiences significant volatility as the market digests the preceding rally and establishes new equilibrium levels. The reduced rate of new Bitcoin issuance continues to constrain supply, while demand dynamics determine whether this supply restriction translates to price appreciation.
However, each cycle demonstrates diminishing returns in percentage terms, a natural consequence of Bitcoin’s growing market capitalization. While past second-year post-halving periods saw substantial gains, the base from which 2026 operates is significantly larger, suggesting any percentage moves will be more moderate than previous cycles.
The halving cycle framework remains relevant but should be viewed as one input among many rather than a deterministic roadmap.
Institutional Adoption Metrics
Institutional participation in Bitcoin markets has evolved dramatically, fundamentally changing market structure and behavior. Spot Bitcoin ETFs have channeled billions into the asset, creating new demand sources that didn’t exist in previous cycles.
Flow data from these institutional products provides real-time sentiment indicators. Sustained inflows suggest continued institutional conviction, while outflows signal reduced appetite. The pattern of these flows heading into 2026 will significantly influence price trajectory, as institutional capital operates at scales that can move markets.
Corporate treasury adoption represents another institutional dimension. Companies holding Bitcoin on their balance sheets create permanent demand, removing supply from circulation. The pace of corporate adoption announcements has varied, but any acceleration into 2026 would represent a fundamental shift in Bitcoin’s utility beyond speculative trading.
Custody solutions, regulatory clarity, and traditional finance integration all continue maturing, reducing friction for institutional participation. These infrastructure developments don’t generate immediate price impacts but create conditions for sustained institutional involvement that supports long-term price discovery.
On-Chain Data Trends
Blockchain transparency provides unique datasets unavailable in traditional markets. Current on-chain metrics reveal several trends relevant to Bitcoin’s 2026 outlook:
The supply held by long-term holders has reached elevated levels, indicating strong conviction among investors who’ve held through volatility. These “HODLers” remove supply from active circulation, reducing selling pressure during drawdowns. However, when long-term holders begin distributing—typically during euphoric rallies—it often marks cycle peaks.
Exchange balances continue trending downward, with Bitcoin flowing from exchanges to self-custody solutions and institutional custody providers. This movement represents supply leaving immediately accessible selling venues, creating potential supply squeezes if demand surges.
Transaction volume and network activity provide usage indicators beyond price speculation. While trading remains dominant, Bitcoin’s utility for value transfer continues growing in specific corridors and use cases. Network security, measured by hash rate, has reached all-time highs despite price volatility, indicating miner confidence in long-term economics.
The Realized Price—the average price at which all existing Bitcoins last moved—serves as a cost-basis indicator for the market. Current prices relative to Realized Price help identify whether the market is trading at a premium or discount to the average participant’s acquisition cost, informing sentiment and potential selling pressure.
Macroeconomic Correlations
Bitcoin’s relationship with traditional markets has evolved, with correlations strengthening during risk-off events and weakening during crypto-specific developments. As 2026 approaches, the macroeconomic environment will significantly influence Bitcoin’s trajectory.
Interest rate policy from central banks affects discount rates for all assets and the opportunity cost of holding non-yielding assets like Bitcoin. The direction of rates heading into 2026—whether restrictive policy continues or accommodation returns—will influence capital flows between asset classes.
The U.S. dollar’s strength inversely correlates with Bitcoin and risk assets generally. Dollar weakness often coincides with Bitcoin strength, as international capital seeks alternatives and purchasing power shifts. The dollar’s trajectory depends on factors including trade policy, fiscal dynamics, and comparative economic performance.
Inflation trends matter for Bitcoin’s narrative as an inflation hedge, though this relationship hasn’t proven consistent across all periods. Persistent inflation might support Bitcoin’s long-term case, while disinflation could reduce urgency around alternative stores of value.
Equity market performance, particularly technology stocks, has shown correlation with Bitcoin during certain periods. As risk appetite in traditional markets fluctuates, Bitcoin often moves sympathetically, at least in the short to medium term.
Why Patience Is Crucial in the Current Sideways Market
Historical Precedent for Consolidation Periods
Bitcoin’s price history is characterized by sharp directional moves separated by consolidation periods that test traders’ patience. Current sideways action fits this historical pattern, and understanding previous consolidation phases provides perspective on present conditions.
The 2015-2016 period saw extended consolidation after the 2013-2014 cycle peak and subsequent bear market. Bitcoin spent months trading in relatively tight ranges, frustrating traders accustomed to volatility. This consolidation established the foundation for the 2017 bull market, with patient accumulators rewarded significantly.
Similarly, mid-2018 through early-2019 saw Bitcoin consolidate after the initial decline from the 2017 peaks. This period felt directionless to participants, with breakout attempts failing and support tests creating uncertainty. Eventually, this base supported the 2019 rally and positioned the market for subsequent moves.
The 2023 consolidation phase, following the 2022 bear market bottom, demonstrated similar characteristics. Months of sideways action preceded the late-2023 rally that established a new market structure heading into 2024.
These historical examples share common features: reduced volatility, trader frustration, declining interest and engagement, and eventual resolution that rewards those who maintained positions through the uncertainty. Current conditions exhibit these same characteristics.
Risk of Overtrading in Range-Bound Conditions
Sideways markets create specific risks that differ from trending environments. The temptation to trade every small move within the range leads to common pitfalls that erode capital and positioning:
Whipsaw losses accumulate when traders attempt to capture small range movements. Bitcoin moves to resistance, triggering long positions, then reverses before reaching profit targets. The pattern repeats at support with short positions. Each failed trade incurs transaction costs and potential losses, while the overall market position remains unchanged.
Emotional fatigue results from constant position management without meaningful progress. This psychological toll leads to poor decision-making at critical moments. When the range finally breaks, overtired traders often miss the move or doubt the breakout after numerous false starts.
Position size creep represents another risk, where traders increase leverage or position size to generate meaningful returns from small moves. This creates vulnerability when the inevitable range expansion occurs, potentially stopping our enlarged positions exactly when the anticipated directional move begins.
The opportunity cost of active management versus patient positioning becomes clear when comparing results. Traders who executed dozens of range-bound trades often underperform those who simply held positions, avoided overtrading, and waited for high-probability setups.
Position Building Strategies
Sideways markets offer opportunities for strategic position building that trending markets don’t provide. Patient traders can use consolidation periods to accumulate positions at favorable levels:
Dollar-cost averaging (DCA) removes timing pressure by spreading purchases across time. Regular buys at predetermined intervals capture average prices within the range, eliminating the need to perfectly time the bottom. This strategy performs particularly well during extended consolidations, as consistent buying at range lows builds positions below eventual breakout levels.
Range-based accumulation targets specific price zones for purchases. When Bitcoin reaches the lower portion of its established range, buyers add to positions. As price rises to range highs, they pause accumulation or take partial profits. This approach captures range inefficiencies while building core positions for eventual directional moves.
Volatility selling through options strategies generates income during low-volatility consolidations. Selling covered calls against holdings or implementing spreads takes advantage of elevated option premiums during quiet markets. This strategy requires options access and understanding, but can meaningfully enhance returns during sideways periods.
Rebalancing portfolios during consolidation maintains target allocations without chasing performance. As other assets move while Bitcoin consolidates, rebalancing systematically sells outperforming assets and adds to Bitcoin positions, enforcing a disciplined buy-low approach.
Conclusion: Preparing Your 2026 Bitcoin Strategy
Bitcoin’s current technical and fundamental landscape presents both challenges and opportunities for traders planning 2026 positions. The chart patterns, fundamental developments, and market structure all point toward a resolution period approaching, likely establishing the trajectory that will characterize much of 2026.
The critical levels identified through technical analysis provide a roadmap: specific resistance zones that must break to confirm bullish continuation, and support levels that must hold to prevent deeper corrections. These aren’t arbitrary lines but areas where significant capital has previously transacted and will likely defend again.
Fundamental factors—halving cycle positioning, institutional flows, on-chain metrics, and macroeconomic conditions—create the backdrop against which technical patterns will resolve. The interplay between these fundamental forces and technical levels will determine whether 2026 sees Bitcoin establishing new all-time highs or consolidating gains within existing ranges.
Patience remains the most valuable trait for current conditions. History demonstrates that consolidation periods, while frustrating, establish the foundations for subsequent trends. Overtrading the range risks capital and positioning exactly when the directional move begins.
For active traders planning 2026 positions, the path forward involves:
– Identifying specific technical levels that will trigger position adjustments
– Monitoring fundamental developments that could accelerate or reverse trends
– Maintaining discipline during consolidation rather than forcing trades
– Building positions strategically during range-bound periods
– Preparing execution plans for various breakout scenarios
The charts are telling a story of compression and pending resolution. The fundamentals suggest multiple possible trajectories depending on how institutional adoption, regulatory developments, and macroeconomic conditions evolve. 2026’s direction isn’t predetermined, but the current landscape provides sufficient information for informed positioning.
What the charts tell us now is that Bitcoin stands at a decision point. The resolution of current patterns will likely establish the framework for 2026’s trading environment. Those who approach this period with patience, discipline, and strategic planning will be best positioned to capitalize on whatever direction ultimately emerges.
Frequently Asked Questions
Q: What are the most important Bitcoin chart patterns to watch heading into 2026?
A: The most critical patterns include the weekly timeframe consolidation range, triangle formations showing compression, and the convergence of major moving averages (50-week and 200-week). The boundaries of the current consolidation range represent key levels that, when broken, will likely determine Bitcoin’s directional bias through 2026. Volume profile analysis also highlights high-volume nodes within the range and low-volume zones below current prices that could see rapid movement during breakouts.
Q: How does Bitcoin’s halving cycle affect its 2026 outlook?
A: 2026 falls approximately two years after the 2024 halving, a period that historically marks the latter stages of bull markets or transitions into consolidation. The reduced Bitcoin issuance continues constraining supply, but each cycle shows diminishing percentage returns due to Bitcoin’s growing market cap. While the halving cycle framework remains relevant, it should be viewed as one factor among many rather than a deterministic predictor, especially as market structure evolves with increased institutional participation.
Q: What fundamental indicators are most important for Bitcoin’s 2026 trajectory?
A: Key fundamental indicators include institutional adoption metrics (particularly ETF flows), on-chain data such as long-term holder supply and exchange balances, and macroeconomic factors including interest rate policy and U.S. dollar strength. Corporate treasury adoption, regulatory developments, and network fundamentals like hash rate also provide insight into Bitcoin’s underlying demand and security. The interplay between these factors and technical levels will likely determine 2026’s direction.
Q: Why should traders be patient during Bitcoin’s current sideways market?
A: Historical precedent shows that consolidation periods, while frustrating, establish foundations for subsequent trends. Overtrading during range-bound conditions leads to whipsaw losses, emotional fatigue, and position size creep that erodes capital. Sideways markets offer opportunities for strategic position building through dollar-cost averaging, range-based accumulation, and volatility selling strategies. Traders who maintain discipline during consolidation are typically better positioned when directional moves finally emerge.
Q: What specific levels should Bitcoin traders monitor for the 2026 direction?
A: Traders should focus on the upper boundary of the current consolidation range where previous sellers have emerged, coinciding with the 200-week moving average on some timeframes. The lower support zone represents previous resistance that flipped to support and has absorbed multiple selling pressures. Secondary intermediate levels between these primary zones act as potential pivot points. Volume profile point-of-control levels indicate fair value areas, while the Realized Price provides insight into the average market participant’s cost basis.
Q: How can traders build positions strategically during Bitcoin’s consolidation?
A: Strategic position building during consolidation includes dollar-cost averaging with regular purchases at predetermined intervals to capture average range prices, range-based accumulation that targets the lower portion of established ranges, volatility selling through options strategies to generate income during quiet periods, and portfolio rebalancing that systematically adds to Bitcoin positions as other assets outperform. These approaches build favorable positioning for eventual directional moves without attempting to perfectly time the market.