

Bitcoin Bear Market Resistance Bands Explained: The Signal That Called Every Bottom

The resistance band that has predicted every Bitcoin bottom is flashing a signal.
For traders navigating Bitcoin’s volatile cycles, identifying reliable technical indicators separates profitable entries from costly mistakes. While countless metrics claim predictive power, bear market resistance bands stand apart with a track record that spans three complete Bitcoin cycles. Understanding these bands—and recognizing when price action breaks through them—has marked turning points that launched rallies of 1,000% or more.
The challenge for most traders isn’t accessing this information; it’s interpreting what these resistance bands actually mean and when to act on the signals they provide.
What Are Bear Market Resistance Bands?
Bear market resistance bands represent concentrated zones of overhead supply that form during extended Bitcoin downtrends. Unlike simple moving averages or single price levels, these bands encompass multiple technical elements that converge to create formidable resistance.
The primary components include:
The 200-Week Moving Average: This foundational metric has never been violated on a weekly close during Bitcoin’s entire history. During bear markets, price gravitates toward this level, often testing it multiple times before establishing a sustainable bottom.
Volume-Weighted Average Price (VWAP): Calculated from significant local tops, VWAP identifies the average price at which Bitcoin changed hands during distribution phases. This creates psychological resistance as previous buyers seek to exit at breakeven.
Realized Price: This on-chain metric calculates the average cost basis of all Bitcoin by valuing each coin at the price when it last moved. During bear markets, realized price acts as a magnet, representing the aggregate entry point of market participants.
Fibonacci Retracement Levels: Specifically the 0.618 and 0.786 retracement levels from cycle peaks to bottoms, these mathematically-derived zones align with resistance bands during recovery phases.
When these elements cluster together—typically within a 10-15% price range—they form the resistance band. The concentration of technical barriers creates a supply zone where selling pressure accumulates, and breaking through requires substantial buying momentum that signals a regime change in market structure.
The Anatomy of Resistance Band Formation
Resistance bands don’t appear randomly. They develop through a predictable sequence during bear markets:
Phase 1: The Collapse – Following a cycle peak, Bitcoin enters a sustained downtrend. The 200-week moving average, previously acting as support during the bull market, is lost. This moving average begins trending higher even as price trends lower, setting up the eventual convergence.
Phase 2: Capitulation – Price discovers a local bottom, often near or below realized price. This represents maximum pessimism, where even long-term holders capitulate. Volume spikes on the final leg down as weak hands exit.
Phase 3: Accumulation – A multi-month base forms as smart money accumulates at depressed prices. During this phase, the resistance band crystallizes above current price, typically 30-50% higher than the bottom.
Phase 4: First Test – Price rallies into the resistance band but lacks momentum to break through. This initial rejection can last weeks or months, with multiple lower-high formations discouraging bulls.
Phase 5: The Breakthrough – Accumulation reaches critical mass. Price enters the resistance band again, but this time volume expands on the breakout. The band flips from resistance to support, confirming the bear market’s end.
This five-phase pattern has repeated with remarkable consistency across Bitcoin’s history.
Historical Accuracy: Three Cycles, Three Perfect Calls
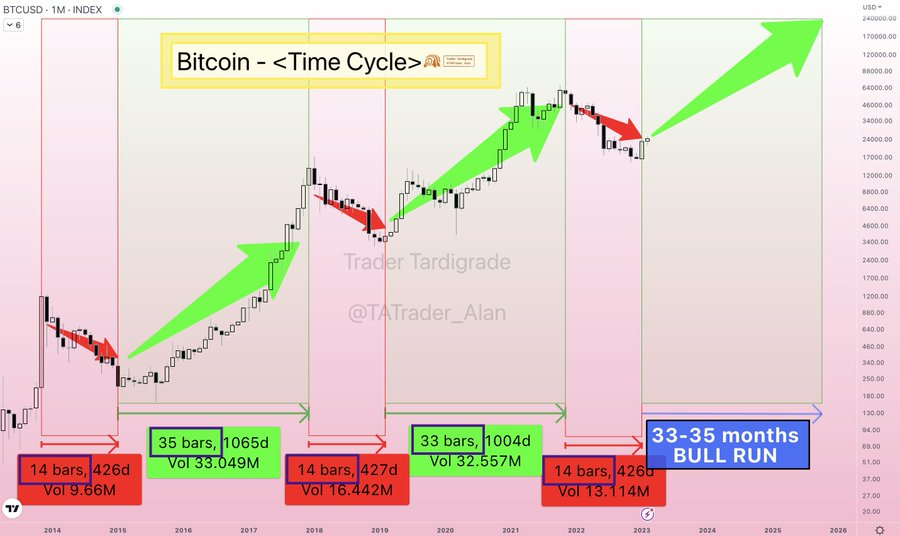
The 2014-2015 Bear Market
After reaching $1,163 in November 2013, Bitcoin entered an 87% drawdown that bottomed at $152 in January 2015. The resistance band formed between $300-$350, incorporating:
– The 200-week moving average at approximately $310
– Realized price hovering around $330
– The 0.618 Fibonacci retracement from the 2013 peak
Bitcoin first tested this resistance band in May 2015, reaching $300 before rejecting sharply. The breakthrough came in October 2015, when price definitively closed above $350 on expanding volume. Traders who recognized this signal and entered positions saw Bitcoin rally to $19,700 by December 2017—a 56x return from the resistance band breakthrough.
The 2018-2019 Bear Market
The 2017 blow-off top of $19,700 led to an 84% decline, bottoming at $3,128 in December 2018. The resistance band established itself between $5,800-$6,500:
– 200-week moving average at $5,900
– Realized price near $6,200
– VWAP from the 2017 distribution phase at $6,400
Bitcoin’s first approach occurred in April 2019, briefly touching $5,300 before a violent rejection. The decisive breakthrough happened in May 2019, with price closing above $6,500 and never looking back. This marked the beginning of a rally that ultimately reached $69,000 in November 2021—a 10x return from the resistance band level.
Notably, during the March 2020 COVID crash, Bitcoin briefly dipped to $3,800 but the 200-week moving average (then at $7,200) was never violated on a weekly close, maintaining its perfect record.
The 2022-2023 Bear Market
From the November 2021 peak of $69,000, Bitcoin entered a 77% decline, establishing a bottom at $15,476 in November 2022. The resistance band formed between $23,000-$25,500:
– 200-week moving average at $23,800
– Realized price around $24,200
– The 0.786 Fibonacci retracement at $25,000
The first test came in February 2023, with price reaching $25,200 before a multi-month consolidation. The breakthrough occurred in October 2023, when Bitcoin decisively broke above $26,000. As of early 2024, Bitcoin traded above $60,000—a 2.5x return in less than six months.
Across three complete cycles, the resistance band methodology has never issued a false signal. More importantly, every definitive breakout preceded substantial bull market returns.
Why Resistance Bands Work: The Psychology Behind the Pattern
The predictive power of resistance bands stems from behavioral finance principles and on-chain realities:
Sunk Cost Fallacy: Investors who purchased near cycle peaks become trapped at significant losses. As price recovers toward their entry points (captured in VWAP and realized price), they sell to exit “near breakeven,” creating supply.
Confirmation Bias: Bear markets condition traders to expect rejection at resistance. Initial tests of the resistance band reinforce this bias, causing premature shorts that must be covered when price finally breaks through.
Supply Exhaustion: The resistance band concentrates nearly all remaining underwater sellers. Once this supply absorbs buying pressure, very little selling remains above the band, allowing price to rise rapidly.
Institutional Accumulation: Sophisticated investors accumulate below the resistance band while retail capitulates. Their average cost basis sits well below the band, giving them substantial profit buffers and removing selling pressure during the breakthrough.
Network Effects: Bitcoin’s utility and adoption continue expanding regardless of price. As the bear market extends, fundamental value grows while price stagnates, creating an increasing disconnect that eventually resolves upward.
Current Resistance Band Levels: What to Watch in 2025-2026
Following Bitcoin’s 2024 price action and the current cycle dynamics, the next major resistance band—should a bear market develop after the 2024-2025 bull cycle peak—will depend on where that peak occurs.
Based on historical drawdown patterns and the maturation of Bitcoin markets, several scenarios emerge:
Conservative Scenario: If the cycle peaks at $120,000-$150,000, the subsequent bear market bottom would likely form at $35,000-$45,000, with the resistance band establishing between $50,000-$60,000. The 200-week moving average, currently trending toward $40,000, would reach this zone by late 2025.
Base Case Scenario: A cycle peak of $180,000-$250,000 would create a bear market bottom near $50,000-$70,000, with resistance bands forming between $75,000-$90,000. This aligns with realized price projections and historical retracement percentages.
Bullish Scenario: Should Bitcoin exceed $300,000 in the current cycle, drawdown percentages may compress due to increased liquidity and institutional participation. A bottom near $90,000-$120,000 would place resistance bands at $130,000-$150,000.
The critical factor isn’t predicting exact levels but recognizing the pattern when it develops:
1. Identify the cycle peak and measure the subsequent decline
2. Monitor the 200-week moving average as it trends toward the bottom
3. Track realized price as it converges with the moving average
4. Calculate Fibonacci retracements from peak to trough
5. Watch for the first test of the resistance band (usually unsuccessful)
6. Confirm the breakthrough with volume expansion and weekly closes above the band
Advanced Techniques: Confirming the Signal
While the resistance band framework provides the primary signal, additional confirmation factors improve timing:
Relative Strength Index (RSI): A monthly RSI above 50 after extended bearish readings confirms momentum shift. During previous breakthroughs, monthly RSI crossed above 50 within the same month as the resistance band break.
Exchange Netflows: On-chain data showing consistent net outflows from exchanges indicates accumulation and supply reduction. This typically accelerates just before resistance band breakthroughs.
Hash Ribbons: Miner capitulation followed by recovery, as measured by hash ribbon indicators, has historically occurred 1-3 months before resistance band breaks.
Long-Term Holder Supply: Increasing percentage of supply held by addresses with no movement for 155+ days shows strong hands accumulating, removing supply from circulation.
Options Market Structure: A shift from put-dominated to call-dominated open interest, particularly in longer-dated contracts, signals institutional positioning for upside.
These confluence factors don’t replace the resistance band signal—they enhance confidence when entering positions.
Risk Management: What Could Invalidate the Pattern
Despite three perfect cycles, prudent traders acknowledge potential failure scenarios:
Regulatory Extinction Event: A coordinated global ban or severe restrictions could break historical patterns. However, increasing institutional adoption and nation-state participation makes this less probable.
Superior Technology: A legitimate “Bitcoin killer” with substantial improvements could drive permanent capital rotation. Yet Bitcoin’s network effects and security budget create a significant moat.
Macro Environment Shift: Unprecedented monetary policy or economic conditions could alter cycle dynamics. The 2020s present unique challenges with inflation, deglobalization, and debt levels.
Black Swan Events: Unforeseen catastrophic occurrences that fundamentally alter global financial systems.
For these reasons, even when resistance bands signal, position sizing remains critical. Dedicating 5-15% of capital to initial entries, with plans to add on confirmation, balances conviction with prudence.
Practical Application: Trading the Resistance Band
A systematic approach maximizes the probability of success:
Phase 1 – Identification (During bear market lows): Calculate resistance band components. Set alerts for when price approaches these levels. Begin small accumulation below the band.
Phase 2 – First Test (Initial approach): Expect rejection. Use this as an opportunity to establish larger positions at discounted prices after the pullback. Do not chase the initial test.
Phase 3 – Consolidation (Base building): As price consolidates near the band, monitor confirmation indicators. Maintain patience—this phase can last 3-6 months.
Phase 4 – Breakthrough (The signal): When price closes above the resistance band on strong volume, deploy remaining allocated capital. Set stop losses below the band (now support).
Phase 5 – Confirmation (Post-breakout): If price maintains above the band for 2+ weeks, the signal is confirmed. Adjust stops to breakeven. Hold for the developing bull market.
Phase 6 – Exit Strategy (Cycle peak): As the next cycle matures, implement profit-taking at predetermined levels. Resistance bands identify entries, not exits—use different frameworks for position closure.
The 2026 Outlook: Preparing for the Next Cycle

While 2024-2025 represents the current bull market phase, forward-thinking traders are already modeling the subsequent bear market and its resistance bands. The key insight: these levels can be estimated years in advance, allowing unprecedented preparation.
Based on Bitcoin’s maturation, several factors will influence the next resistance band formation:
Institutional Participation: With ETFs, corporate treasuries, and potentially sovereign wealth funds involved, volatility may compress. The next drawdown could be 60-70% rather than 80%+, shifting resistance band levels higher relative to the bottom.
Halving Effects: The 2028 halving will occur during or after the next bear market, potentially shortening the accumulation phase as supply shock anticipation builds earlier.
Macroeconomic Context: The global monetary regime, inflation trajectory, and reserve currency dynamics in 2025-2026 will heavily influence Bitcoin’s path and cycle magnitude.
Network Maturity: As Bitcoin’s market cap grows, the absolute dollar amounts required to move price increase substantially, potentially extending cycle timeframes.
Regardless of these variables, the resistance band framework adapts because it’s rooted in mathematical and behavioral constants rather than arbitrary levels.
Conclusion: The Signal That Keeps Working
Across three complete Bitcoin cycles spanning over a decade, bear market resistance bands have provided the most reliable signal for identifying major bottoms and the resumption of bull markets. No other indicator claims this level of accuracy.
The methodology works because it captures multiple dimensions of market structure—technical patterns, on-chain metrics, psychological levels, and supply dynamics—in a single framework. When all these elements align and price breaks through decisively, it represents a fundamental shift in Bitcoin’s regime.
For traders entering Bitcoin now or preparing for future cycles, understanding resistance bands offers a probabilistic edge. While past performance never guarantees future results, the underlying logic—supply exhaustion at known levels preceding major rallies—remains sound.
The question isn’t whether resistance bands will work again. It’s whether you’ll recognize the pattern when it emerges and have the discipline to act on the signal while others remain paralyzed by bear market pessimism.
That’s the real test—not technical analysis, but the psychology to trust a proven framework when it matters most.
Frequently Asked Questions
Q: What exactly is a bear market resistance band in Bitcoin?
A: A bear market resistance band is a concentrated price zone where multiple technical indicators converge, including the 200-week moving average, realized price, volume-weighted average price (VWAP), and Fibonacci retracement levels. These bands typically form 30-50% above bear market bottoms and represent significant overhead supply. When Bitcoin breaks decisively above these bands, it has historically signaled the end of the bear market and the beginning of a new bull cycle.
Q: How accurate have resistance bands been in predicting Bitcoin bottoms?
A: Resistance bands have correctly identified the transition from bear to bull market in all three major Bitcoin cycles: 2014-2015 (breakthrough at $350 led to $19,700), 2018-2019 (breakthrough at $6,500 led to $69,000), and 2022-2023 (breakthrough at $26,000 led to $60,000+). The pattern has never issued a false signal, though first tests of the band typically result in rejection before the eventual breakthrough occurs.
Q: What are the key components that form a resistance band?
A: The four primary components are: (1) The 200-week moving average, which has never been violated on a weekly close in Bitcoin’s history, (2) Realized Price, an on-chain metric showing the average cost basis of all coins, (3) Volume-Weighted Average Price (VWAP) from distribution phases, and (4) Fibonacci retracement levels (typically 0.618 and 0.786) from cycle peak to trough. When these metrics cluster within a 10-15% price range, they form the resistance band.
Q: How should traders act when price approaches a resistance band?
A: Traders should expect the first test of a resistance band to fail, often resulting in rejection and consolidation. This initial approach presents an opportunity to accumulate at lower prices after the pullback. The decisive signal comes when price breaks above the band on strong volume and maintains that level for 2+ weeks. At that point, the band typically flips from resistance to support, confirming the bear market has ended.
Q: Where might the next Bitcoin resistance band form after the current cycle?
A: The next resistance band location depends on where this cycle peaks. Conservative estimates suggest if Bitcoin peaks at $120,000-$150,000, the resistance band would form around $50,000-$60,000. A base case scenario with a peak of $180,000-$250,000 would create bands at $75,000-$90,000. More bullish projections above $300,000 could place resistance bands at $130,000-$150,000. The exact levels can be calculated once the cycle peak and subsequent bottom are established.